WebStats
WebStats lets you monitor your internet connection from any other computer with an internet connection. All that is required is some free space on an internet host to which you have access. Most likely, your internet service provider has assigned some space for you to put up a home page. This will do fine. WebStats works by generating a HTML page (which will be reviewed below) and uploading it to your host. Since the page is based on pure HTML, you can monitor your connection from any other computer, as long as it has a browser and an internet connection.
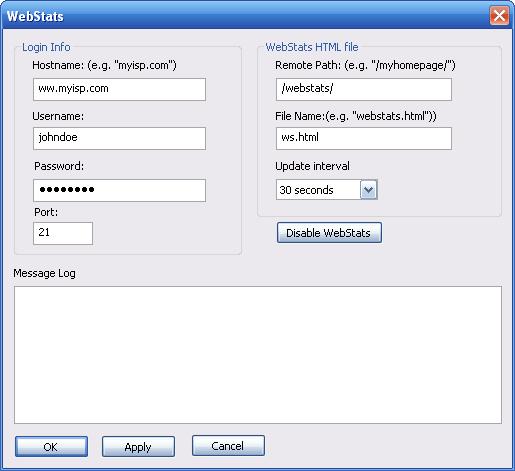
The WebStats window is divided into the following three areas.
Login Info
Hostname, username and password should be the ones you use to login to your homepage. Port is 21 by default and should rarely be changed.
WebStats HTML File
Remote path should in most cases contain the path on the host to your homepage space. It can, however, also be left empty if the stats page is supposed to be in the root of the domain.
In File Name you provide a name of your choosing for the HTML file generated by WebStats.
Update Interval determines how often WebStats should update the HTML page.
Enable WebStats/Disable WebStats
The name of this button will change based on whether WebStats is disabled or enabled. Disabling WebStats will not erase all your login information etc. but just cause WebStats not to post updates to the HTML page.
Message Log
This is where all information regarding the communication with your web host goes. At each attempt to upload the WebStats HTML page, a message will be posted here either saying the upload was succesful or explaining what error was encountered. If something is not working, this is a good place to look.
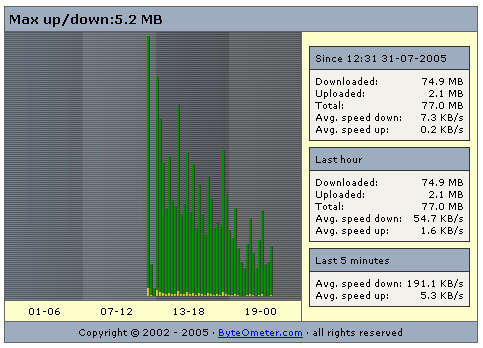
The WebStats page
The generated WebStats page is available via your browser (by typing e.g. myisp.com/myhomepage/webstats.html in the address field). The graph represents the network traffic during the last 24 hours. An hour is divided into units of 15 minutes giving a total of 24*4=96 bars.
As a reference for measuring the amount of traffic during the last 24 hours, the y-axis maximum is displayed on top of the graph (Max up/down).
The green part of the bars represents download while the yellow represents upload. To the right of the graph is various statistical information such as average speeds, amount of traffic during the last five minutes, the last hour and since WebStats was activated.
Please note, that the WebStats page represents only data collected since WebStats was turned on.
Copyright © 2006, FortaWare - Back to ByteOMeter - The Bandwidth Monitor Homepage